FY14 Army Share of Defense and Federal Small Business Contracting
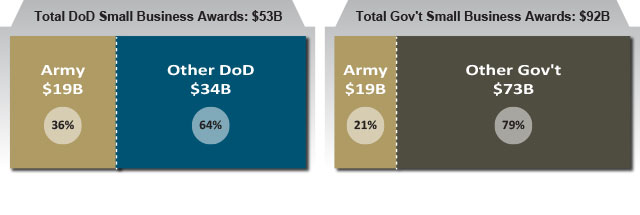
Text alternative for FY14 Army Share of Defense and Federal Small Business Contracting
FY14 Army Small Business Spend by Industry Area
Below is a chart that breaks down the Army spent with small businesses in FY14 by industry area.
For further information on how these categories are defined, please see the DoD Portfolio Taxonomy (www.acq.osd.mil/dpap/ss/taxonomy.html).
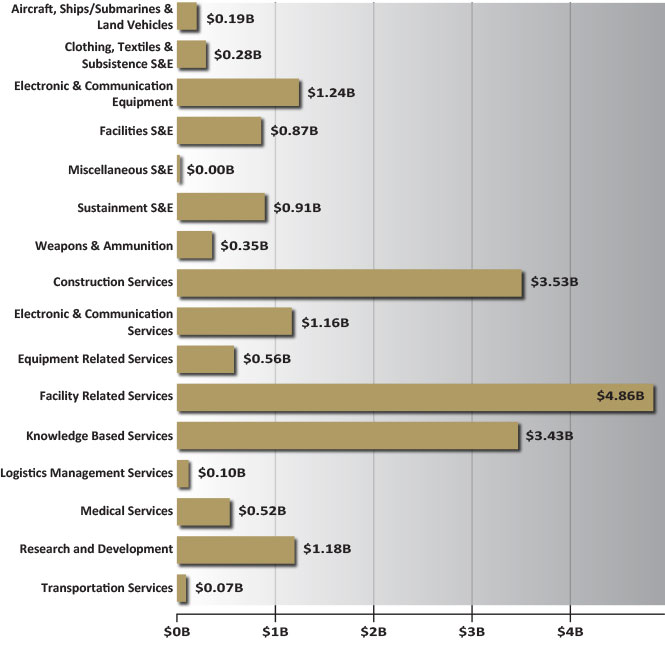
Text alternative for FY14 Army Small Business Spend by Industry Area
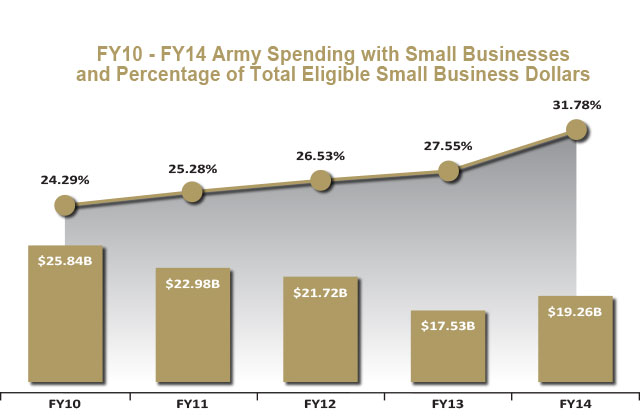
Text alternative for Army Small Business Spend FY10 – FY14
FY14 Army Small Business Spending by Congressional District
Below is an interactive intensity map that presents FY14 Army small business spend by congressional district. Clicking on a congressional district will show the district name, Army total eligible small business spend, Army small business spend, and the percentage of total eligible spend that the small business spend comprises. Spending is based on the location of the contractor.
| FY14 Army Small Business Spend | ||||
| < $10,000,000 | $50,000,000 to $75,000,000 | |||
| $10,000,000 to $25,000,000 | $75,000,000 to $1,000,000,000 | |||
| $25,000,000 to $50,000,000 | > $1,000,000,000 | |||